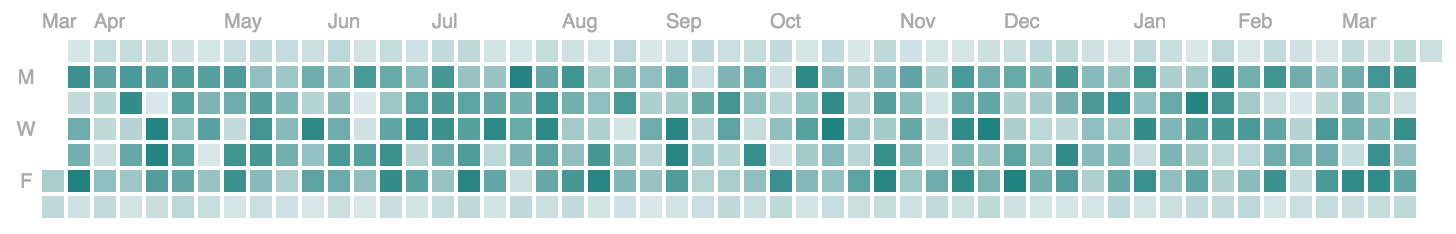
A heatmap representing time series data, inspired by GitHub's contribution chart.
| Property | Usage | Default | Required |
|---|---|---|---|
| data | Chart data | none | yes |
| selector | DOM selector to attach the chart to | body | no |
| width | Chart width (grid + legend) | 750 | no |
| height | Chart height (grid) | 110 | no |
| cellSize | Day cell size in pixels (before padding) | 11 | no |
| cellPadding | Gap between day cells in pixels | 2 | no |
| fitWidth | Auto-resize cell size to fit the provided width | false | no |
| minCellSize | Minimum cell size when fitWidth is true |
6 | no |
| maxCellSize | Maximum cell size when fitWidth is true |
18 | no |
| legendWidth | Legend area width | 150 | no |
| legendSteps | Number of legend swatches | 4 | no |
| legendGap | Gap between legend swatches | 2 | no |
| legendOffset | Vertical spacing between grid and legend | 8 | no |
| max | Maximum count | max found in data | no |
| startDate | Date to start heatmap at | 1 year ago | no |
| dateParser | Custom function to parse date inputs | new Date(...) |
no |
| weekStart | Week start day ('sunday' or 'monday') | 'sunday' | no |
| colorRange | Minimum and maximum chart gradient colors | ['#D8E6E7', '#218380'] | no |
| tooltipEnabled | Option to render a tooltip | true | no |
| formatters | Formatting hooks for labels, tooltip, legend, and aria labels | {} | no |
| labels | Control visibility and spacing for day/month labels | {} | no |
| legendEnabled | Option to render a legend | true | no |
| onClick | callback function on day click events (see example below) | null | no |
| onHover | callback function on day hover events | null | no |
| onLeave | callback function on day mouse leave events | null | no |
| onFocus | callback function on day focus events | null | no |
| onBlur | callback function on day blur events | null | no |
| accessibilityTable | Render an accessible, screen-reader-only table of all values | true | no |
| ariaLabel | Accessible chart label | 'Calendar heatmap' | no |
| ariaDescription | Accessible chart description | auto-generated | no |
npm install @goujon/calendar-heatmap1: Import calendar-heatmap and its styles
import calendarHeatmap from '@goujon/calendar-heatmap';
import '@goujon/calendar-heatmap/calendar-heatmap.css';
2: Format the data so each array item has a date and count property.
As long as new Date() can parse the date string it's ok, or provide a custom dateParser. Note - all data should be rolled up into daily bucket granularity.
3: Configure the chart and render it
// chart data example
var chartData = [{
  date: valid Javascript date object,
  count: Number
}];
var chart1 = calendarHeatmap()
              .data(chartData)
              .selector('#chart-one')
              .colorRange(['#D8E6E7', '#218380'])
              .tooltipEnabled(true)
              .onClick(function (data) {
                console.log('onClick callback. Data:', data);
              });
chart1(); // render the chartvar chart1 = calendarHeatmap()
.data(chartData)
.selector('#chart-one')
.ariaLabel('Team activity heatmap')
.ariaDescription('Daily activity for the last 12 months.')
.formatters({
ariaLabel: function (date, count) {
return date.toDateString() + ': ' + count + ' contributions';
}
});
chart1();var chart1 = calendarHeatmap()
.data(chartData)
.formatters({
tooltip: function (date, count) {
var unit = count === 1 ? 'contribution' : 'contributions';
return count + ' ' + unit + ' on ' + date.toDateString();
}
});
chart1(); // render the chartvar chart1 = calendarHeatmap()
.data(chartData)
.width(700)
.fitWidth(true)
.minCellSize(7)
.maxCellSize(12)
.labels({
day: { interval: 1, start: 0 },
month: { padding: 14 }
});
chart1();...are very welcome!
npm run buildnpm run testThis repo uses Changesets for versioning and publishing.
npm run changeset
npm run version
npm run releaseThis repository is a workspace with two packages:
packages/calendar-heatmap(@goujon/calendar-heatmap)packages/react-calendar-heatmap(@goujon/react-calendar-heatmap)
npm install @goujon/react-calendar-heatmapimport { CalendarHeatmap } from '@goujon/react-calendar-heatmap';
import '@goujon/calendar-heatmap/calendar-heatmap.css';npm run demoThis starts a local dev server and opens the showcase page.